Basic Guidance of How To Use Google Analytics

What Is Google Analytics
Google Analytics is a web analytics service offered by Google that tracks and reports website traffic.
Google Analytics is a free Web analytics service that provides statistics and basic analytical tools for search engine optimization (SEO) and marketing purposes. The service is available to anyone with a Google account.
5 Reason Why you should use Google Analytics
- It’s FREE
- Track your goals
- To understand which social platforms to target
- To know the age, gender, interest, device, location of your audience.
- To understand why visitors leaving your Website
How to use
Here We are going to explain easy steps of how to use Google analytics and how it can be a secret weapon for your eCommerce Business.
1.How to Setup Google Analytics & Install on Website. Setup Now
Note: After performing the above steps your google analytics will be Setup successfully.
2. Dashboard
After Login into Google Analytics, you can access the Dashboard. On the Dashboard, you will have an overview of your store visitors, Session [Spend time on your Store], Bounce rate and Session average duration.
From the left side menu, you can access all features of google analytics.

If you are MoreCustomersApp’s user you can view visitors in their own App. Provide their own inbuilt analytics system.

3. Acquisition
The acquisition section tells you, from where users come. such as search engines, social networks or website referrals. This is a key section when determining which online marketing tactics are bringing the most visitors to your website

4. Real-time users
Real-time users mean the visitors who are on your website right now. An active user report can be found under the audience menu.

5. Source And Medium
Source: the origin of your traffic, such as a search engine (for example, google) or a domain (example.com).
Medium: the general category of the source, for example, organic search, paid search or referral.
Below example demonstrates source and medium of traffic.

6. Bounce User
The bounce rate means the average of those visitors who comes to your store and left without doing anything.
New Users: Who is visiting your store first time
Always try to reduce bounce rate, create engaging content or show the most attractive product on the target page so visitors can spend more time and make the decision of buying.

7. The behavior of your store
The Behavior section tells you what your visitors do on your website. Specifically, the reports tell you what pages people visit and what actions they take while visiting.
You can access Behavior reports using the menu in the left sidebar of your Google Analytics dashboard.
You can see the total page view and unique page view of the website. How many times website pages are viewed by visitors.
View the performance of each page so you can make a decision on which page you need to work more or which page needs change.

here you can view page View and product view in moreCustomersApp

8. Demographic
To find the demographics reports, go to the Audience » Demographics.
It gives a demographic breakdown of website visitors. This includes the age of your users and gender.

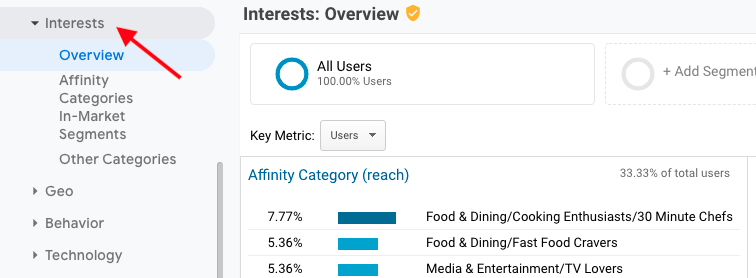
9. Interest
This is a very interesting feature it will show you what type of interested people are visiting your store.
In the below example you can view food, dining, cooking, and Media interested people are visiting more.